Raman pixel by pixel
Raman spectroscopy provides molecular specificity through spectrally-resolved measurement of the inelastic scattering under monochromatic excitation. In the context of microscopy, it may serve as label-free cell imaging, providing structural information. However, the very low cross-section of Raman scattering requires long time exposures, which preclude imaging of cellular components with low concentrations. Surface-enhanced Raman spectroscopy (SERS), which relies on the local electromagnetic field enhancement produced by metallic nanostructures, is an approach to drastically increase the sensitivity of the Raman detection while retaining large amounts of spectral information. In cellular imaging, the measurement is usually performed on endocytosed nanostructures. However, the measured SERS signals vary strongly as they depend on excitation beam profile, local particle presence or aggregation and local molecular environment. Identifying and extracting spectra corresponding to molecules of interest within a SERS data set is very difficult.
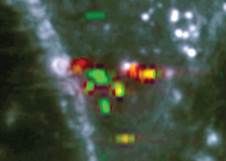
Conventional data analysis methods look for global patterns in the data, whereas the single-molecule sensitivity of SERS can detect independent molecules in each pixel with little correlation between pixels. Nicolas Pavillon and his colleagues from Osaka University now explored different algorithmic methods to automatically discriminate spectra of interest in the measured field of view, without imposing assumptions on the self-similarity of the data. The proposed method relies on the indexing of the positions of relevant spectra, which are selected by the computation of a quality map.
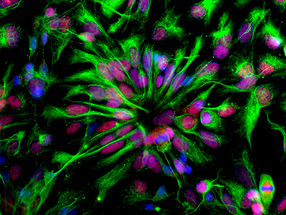
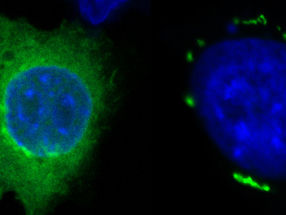
The scientists proposed various criteria to compute spectra extraction, such as the spectral energy, the peak count per spectra, or the projection coefficients on SVD vectors. They assessed each criteria with simulated data and applied this approach to different types of measurements, such as dried Rhodamine 6G adsorbed on gold nanoparticles deposited on a glass substrate, and HeLa cells with endocytosed gold nanoparticles.
The tests with simulated data showed that various criteria can provide satisfactory results. The computation time could be tremendously decreased by discarding irrelevant pixels through a simple criterion based on the spectral energy, reducing the processing time to typically less than 10 seconds for a field of view on the order of 100 X 100 pixels.
The tests performed on Rhodamine 6G measurements demonstrated the validity of the proposed approach, where its known spectrum could be extracted automatically. The peak count criterion was the most suitable for most cases, as it detects various patterns without filtering out any curve which may only appear a single instance in the data set. Such single spectra may be critical important in a given SERS detection experiment. One main feature of the proposed approach is that its output is a localization map of the most relevant spectra in a measurement. The spatial information is retained, making it possible to trace back the positions of several spectra with identical properties, for instance. The optimized method was utilized to extract and classify the complex SERS response behavior of gold nanoparticles taken in live cells.
Original publication
Other news from the department science
Most read news
More news from our other portals
See the theme worlds for related content
Topic World Spectroscopy
Investigation with spectroscopy gives us unique insights into the composition and structure of materials. From UV-Vis spectroscopy to infrared and Raman spectroscopy to fluorescence and atomic absorption spectroscopy, spectroscopy offers us a wide range of analytical techniques to precisely characterize substances. Immerse yourself in the fascinating world of spectroscopy!


![[Fe]-hydrogenase catalysis visualized using para-hydrogen-enhanced nuclear magnetic resonance spectroscopy](https://img.chemie.de/Portal/News/675fd46b9b54f_sBuG8s4sS.png?tr=w-712,h-534,cm-extract,x-0,y-16:n-xl)

